Precipitation Dashboard and Open Data
After my first attempt at making a RSS feed aggregator, I began to feel discouraged. The data that I hoped would be there was disorganized and I felt like every workaround would lead me to a new problem. I took some time away from the code, and I came back with a new approach.
This time, instead of trying to make an aggregator, I decided to instead focus my attention to 3 smaller problems.
Create an automated process for collecting and updating the City of Windsor Open Data Catalogue.
Select and clean one category of the collected data.
Create and launch a dashboard with graphs for the selected category.
Data collection
The first step was to scrap the original RSS feed aggregator. It served its purpose as a learning tool, and gave me enough information to know how I wanted to approach data collection this time.
I made a new RSS feed reader with the purpose of pulling the RSS feed, categorizing it (based on what I learned last time), and committing it to git. While much simpler, this version was annoying to write. Its filled with massive switch-case statements that check for string matching in the title of each RSS feed item. Its ugly, but it does exactly what I need it to do. The short version is that I unmarshal the data into an RSS data type, then I iterate over each item, adding them to their appropriate category. Finally, I iterate over each category and write each item it to a file within the category’s directory.
Once this data was collected, I needed a way to automate the updates. Since the dataset are already stored in git, all I needed to do was run the RSS feed reader, and commit the changes. This was made easy enough using Github Actions.
# set the job to run everyday at 12 (or on manual trigger)
on:
  schedule:
    - cron: '0 12 * * *'
  workflow_dispatch:

jobs:
  build:
    runs-on: ubuntu-latest
    steps:
    - uses: actions/checkout@v3


    - name: Set up Go
      uses: actions/setup-go@v3
      with:
        go-version: 1.19

    - name: Update data
      run: go run rss-feed-reader/main.go

    - name: Commit changes
      uses: EndBug/add-and-commit@v9
      with:
        default_author: github_actions
        add: 'raw/*'
The last step of this action commits the changes in the raw directory using github_actions as the author. Now I have a repository that stores, categorizes and automatically updates itself based on the Windsor Open Data RSS feed.
Selecting and cleaning a category
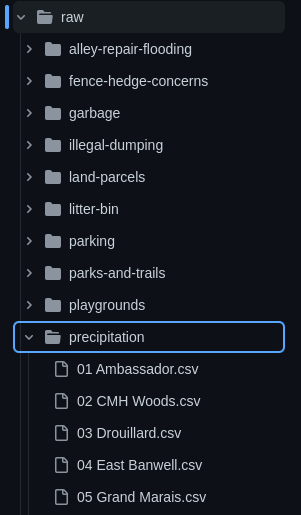
There is a good amount of data made available, and eventually I will like to have touched most, if not all, of the datasets. For now, I chose precipitation data, because I was familiar with that data from my first attempt and already had an idea of how I wanted to clean it.
To do the cleaning, for each file in the raw/precipitation directory, extract the gauge, convert the file into a dataframe (parsing the strangely formatted dates), drop the unused columns, add a column with the gauge name, and return a list of the collected dataframes.
def collect_dataframes(files):
    dfs = []
    for f in files:
        gauge_name = extract_gauge(f)
        # read in the csv file
        df = pd.read_csv(
            f, skiprows=2, parse_dates=["DateTime"], date_format="%m/%d/%Y %H:%M"
        )
        df = drop_unnamed_columns(df)
        df["Gauge"] = gauge_name
        dfs.append(df)
    return dfs
After that, I concatenate the dataframes and write them to a file.
    df_list = collect_dataframes(raw_files)
    # concatenate dataframes
    combined = pd.concat(df_list, ignore_index=True)
    # set the index to 'DateTime'
    combined.set_index("DateTime", inplace=True)
    combined.sort_index(inplace=True)
    # write to file
    combined.to_csv(path.join(args.destination, "windsor-precipitation.csv"))
This data is then stored and pushed to git as well. I opted not to automate the data cleaning process for now, but this might be something I tackle in the future.
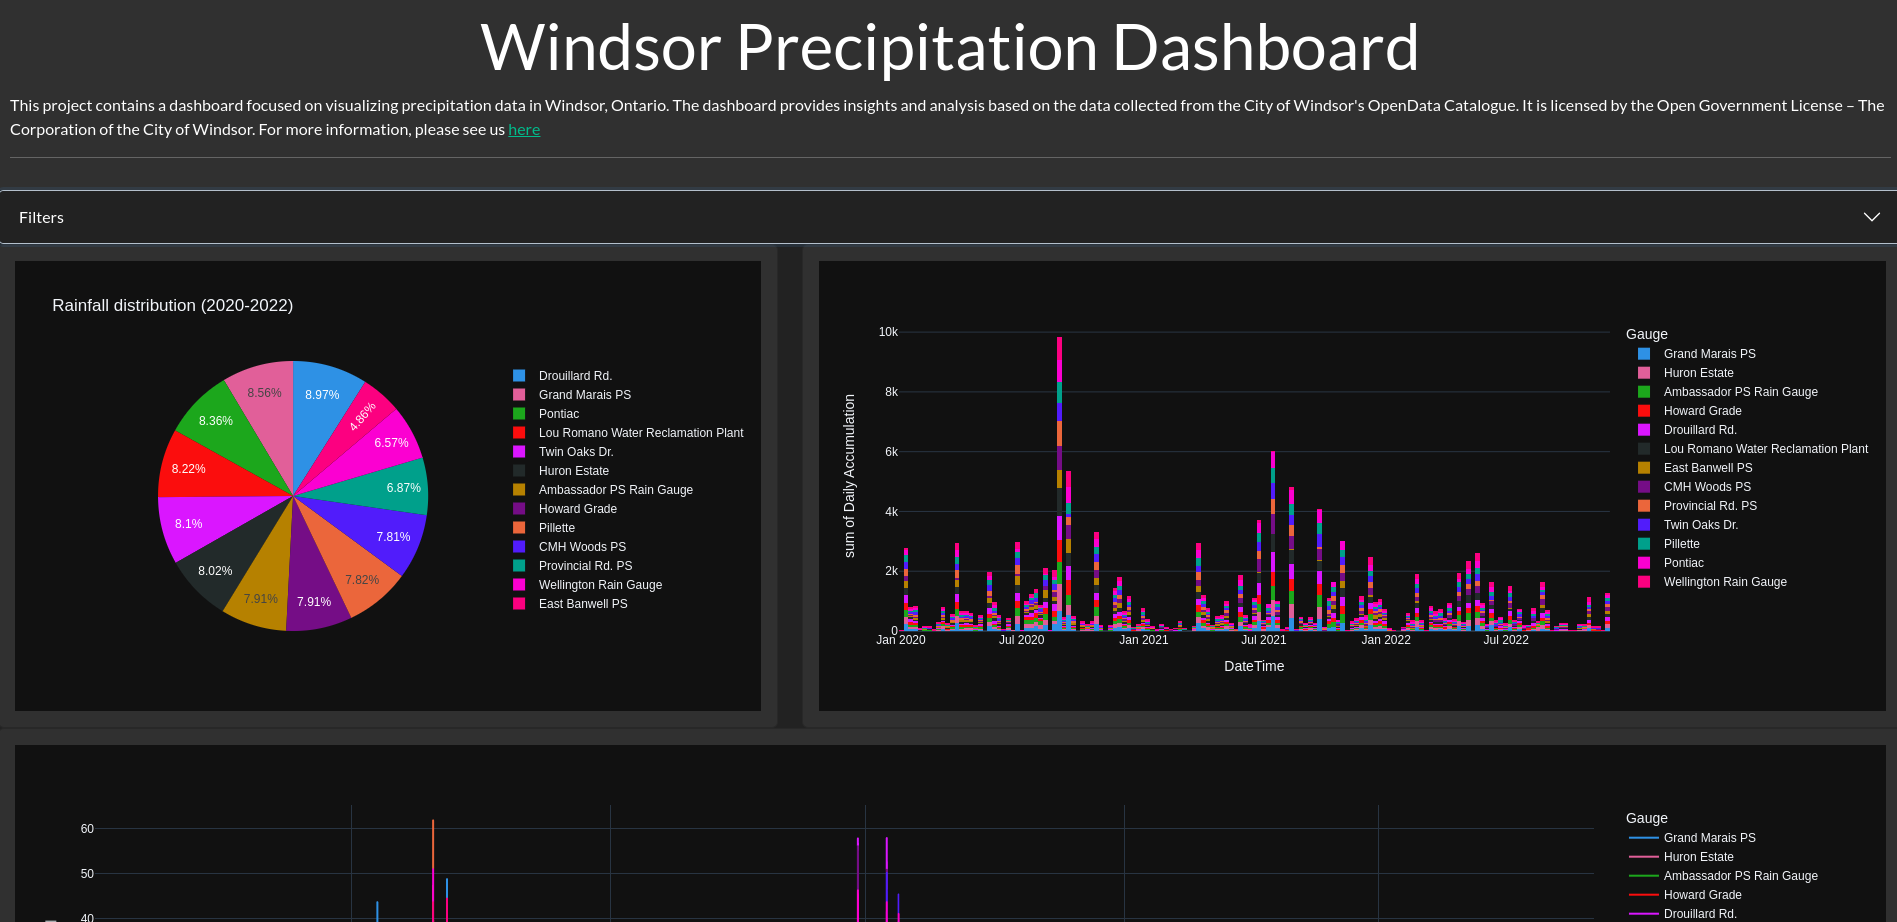
Precipitation Dashboard
The final step was to present the data in a useful way. Unfortunately, this is stepping quite a bit outside of my comfort zone. Fortunately, I am somewhat familiar with using Plotly Dash and was able to put together a small dashboard with some filtering functionality.
You can visit the site now at https://precipitation-dashboard-4a12becc0918.herokuapp.com/ and I’ve made all the code for this dashboard available here.
The dashboard pulls the cleaned data, and provides the following graphs:
- Rainfall distribution pie chart
- Sum of daily precipitation accumulation histogram
- Rainfall total over time line chart
There is definitely room to improve this dashboard, so if you have any suggestions, please feel free to submit a pull request or open an issue on the Github repository.
Keep coding with purpose! ::dev